User Guide
Table of Contents
- Introduction
- Access and Authorization Information
- Description of Home Page
- How Search Works
- Description of Metadata
- Description of Graphs Page
- Signature Matching Tool
- Frequently Asked Questions
- Contact Information
Introduction
The Grid Signature Library (GSL) is a carefully curated, labeled and tagged library of electric power system event signatures. It is a Department of Energy funded project to accelerate the application of Machine Learning (ML)/Artificial Intelligence frameworks to electric grid data for the purposes of interactive signature identification, matching and predictive analytics.
The web-based Graphical User Interface (GUI) allows the user to:
- Search for signatures using event tags
- View associated signature metadata
- View waveforms
- Freely download waveform data in CSV format
- Upload unlabeled/unidentified event data into the basic signature matching tool and have it search for possible matches
[
ToC]
Access and Authorization Information
The URL (Uniform Resource Locator) for GSL is:
https://darknet-01.ornl.gov/apps/siglib
Access to the above resource is freely granted. However, a valid email is required as a 7-day access token is emailed to that address.
The web site does not use usernames and passwords. This protects the user and removes liabilites imposed on the host. A lot of users tend to use the same passwords on multiple web sites on the Internet and not storing passwords prevents loss of that data in the event of a data breach. It also prevents brute-force password cracking attempts from the Internet. Additionally, the developers of the web site are also not privy to the user's passwords, if that information is neither collected nor stored.
This setup allows the site management to compile usage statistics and convey system-related information to users.
[
ToC]
Description of Home Page
Directly below the "Grid Signature Library" heading is the search text box. Immediately to the right, is the Search button to initiate the search.
Below the search text box are some examples of search strings along with a note stating that signature IDs cannot be mixed with event tag strings in a single search operation.
Following that are links to alternate search capabilities. Searching by browsing the Event Tags tree and Event Tags summary are supported.
This is followed, below, by two labeled boxes. The box with the label "Signature Summary by Data Provider" contains a table that lists the data provider along with the total number of signatures in the library from the provider in the column titled "Num Signatures" and the total number of event tags associated with that data provider in the column title "Num Event Tags". Clicking on the numbers will display the signatures and event tags summary, respectively, for the associated data provider.
The second box with the label "Additional Info" contains the following links:
- A link that will allow the user to search for signatures using the old event types assigned to signatures before event tags were introduced
- A flattened listing of the event tags hierarchy
- A link to the the Signature Matching Tool
- A link to this user guide
Data in GSL is anonymized.
[
ToC]
How Search Works
There are primarily seven (7) ways to search for signatures in GSL. They are:
- Using the search text box
- Browsing the event tags tree
- Selecting event tags from Event Tags Summary listing
- Perusing all signatures associated with a data provider
- Selecting from list of event tags associated with a specific data provider
- Searching using signature metadata
- Selecting the old event types associated with signatures
- Using the search text box
-
Every signature stored in GSL is assigned one or more event tags. The event tags are categorized and hierarchically organized. Currently, there are three (3) levels. In this hierarchical tree, a leaf node represents an event tag.
Text entered in the search text box is matched against all the nodes of the hierarchical tree. Multiple search terms (words) are separated with spaces. To match a node name, exactly, with spaces and all, surround the phrase with double quotes.
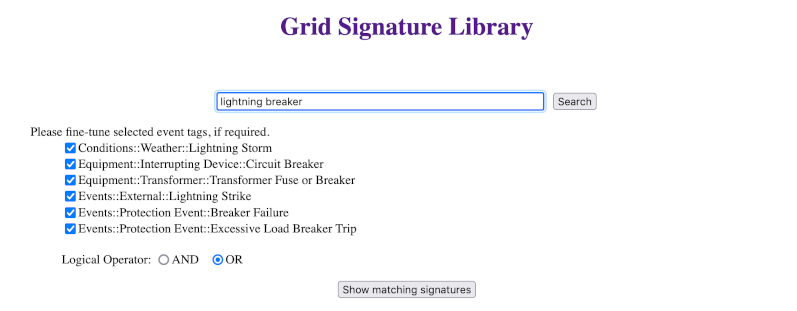
For example, to search for signatures that resulted from a circuit breaker tripping due to a lightning strike, we could type, in the search text box:
lightning breaker
and click on the Search button. The resulting page lists all the matched event tags, pre-selected. See image below:
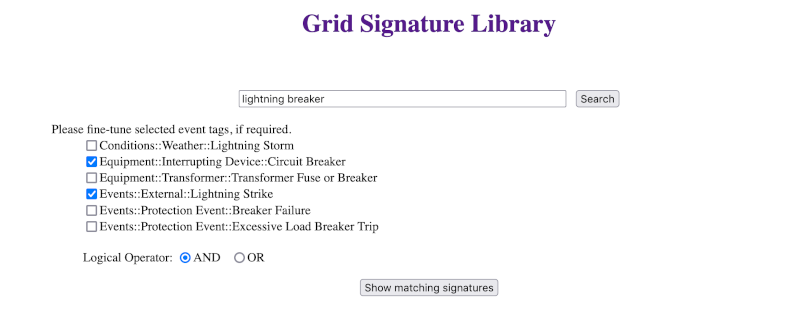
If we were to only select the event tags related to lightning strike and circuit breake, and change the logical operator from OR to AND, like shown in the below image, and press "Show matching signatures" button, we would see information about all the signatures that have both the event tags associated with them.
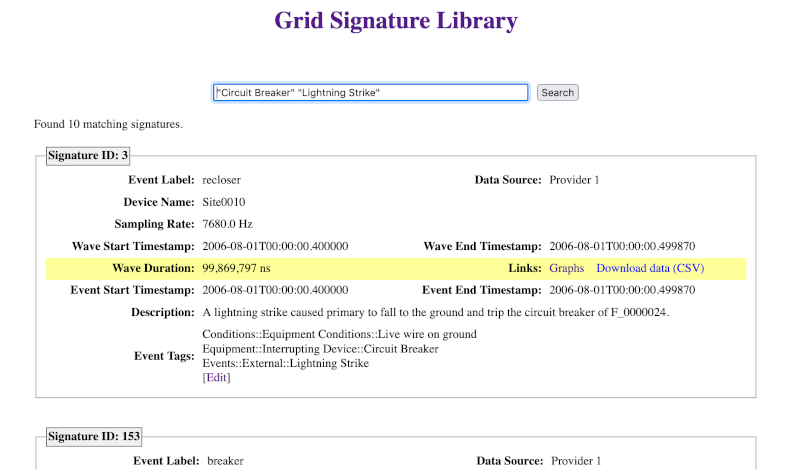
For each matched signature, all available metadata, links to view graphs and download the waveform data in CSV format and assigned event tags are displayed. See Description of Metadata section, below, to see a sample image.
Once again, to search for signatures containing exact event tags names, surround the event tag name in double quotes. For example, typing the below string with surrounding double quotes, in the search text box, like:
"circuit breaker"
will display the event tag "Circuit Breaker" in the sub-category "Interrupting Device" of category "Equipment".
The user may also search for signatures using signature IDs. Multiple signature IDs can be entered by separating them with a space character. When signature IDs are used, the signature information is immediately displayed. Note that signature IDs cannot be mixed with event tag strings.
- Browsing the event tags tree
-
On the home page, under the search text box is a section titled "Alternate search capabilities". In there is a link titled "Search by browsing Event Tags tree". Clicking this link will display the hierarchical tree structure of the event tags and the nested levels, starting with the top-most level. It would like the below image:
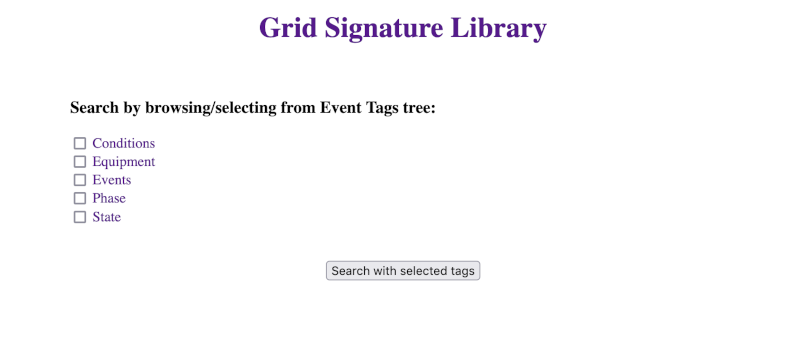
What we see are level 1 nodes. They represent class or category names of the event tags. The displayed entries are clickable. Clicking on them will either expand to show the nested entries at the second level, which may be nodes representing classes or subcategories of event tags, or hide view of the nested entries. If an entry is not clickable, then that entry is a leaf node and represents an event tag.
Checking or unchecking the check box beside a parent node will select or unselect, respectively, all the child nodes of that node.
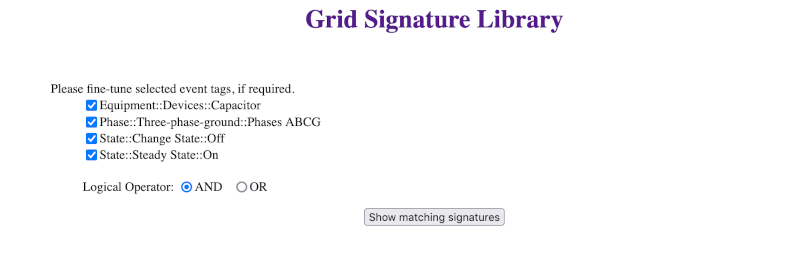
Searching for signatures by browsing and selecting event tags is a very powerful way to search, once we become a little familiar. For example, say, we want to find signatures associated with the following event: A capacitor bank, that is connected to 3-phase Wye circuit, is turned off at a substation and one or more phases did not turn off.
To see if there are any signatures that match the above criteria, we would browse the event tags tree in the following manner:
- Click "Search by browsing Event Tags tree" on the home page
- Click "Equipment", then "Devices" and click the check box beside "Capacitor"
- Next, scroll down and click "Phase" at level 1, then "Three-phase-ground" and click the check box beside "ABCG"
- Scroll down and click "State" at level 1, then "Change State" and click the check box beside "Off"
- Scroll down again and click "Steady State" at level 2 and click the check box beside "On"
- Next, click the "Search with selected tags" button
Changing the Logical operator from the default OR to AND, as shown in the below image, and clicking the Show matching signatures button will display the signatures that match our search criteria.
- Selecting event tags from Event Tags Summary listing
-
On the home page, under the section titled "Alternate search capabilities" is a link titled "Search from Event Tags summary". Clicking on this link will display a page that lists all the event tags currently assigned to signatures in GSL. The information is displayed in a tabular form.
The table lists event tags and the number of signatures that are associated with each event tag. Clicking on the number in the "Num of Signatures" column will take us to a page that displays all the signatures that have that particular event tag assigned to them.
- Perusing all signatures associated with a data provider
-
On the home page is a section titled "Signature Summary by Data Provider". It contains a table that displays the various data providers, anonymized. Against each data provider are a count of total number of signatures from that provider and a count of the total number event tags assigned to the signatures from that provider.
Clicking on the total number of event tags for any given data provider will display a page that shows a listing of the associated event tags assigned to signatures from that provider in tabular form. The column "Num of Signatures" displays the total number of signatures from that data provider that have been assigned that particular event tag. Clicking on that number will display the signatures.
- Selecting from list of event tags associated with a specific data provider
-
This is similar to the Selecting event tags from Event Tags Summary listing functionality described above. The only difference here is that the displayed list is specific to a particular data provider.
- Searching using signature metadata
-
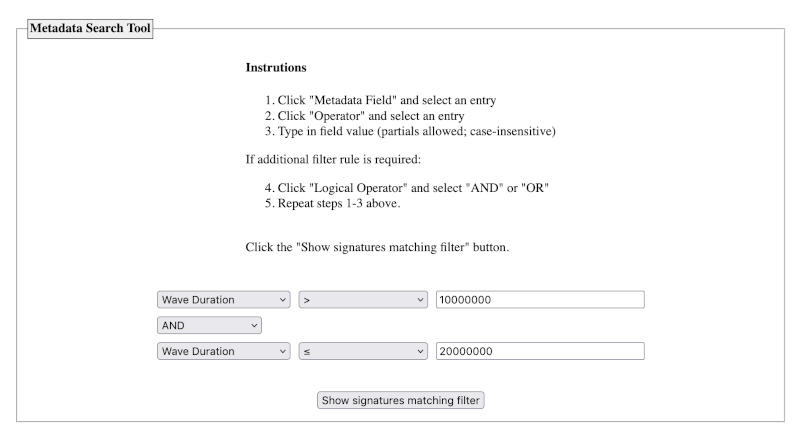
On the home page, in the section titled "Alternate search capabilities" is a link titled "Searching using signature metadata". Clicking on this link will display the Metadata Search Tool. In order to search for signatures using this tool, we build search filter, using one or two rules, by doing the following:
- Selecting a metadata field from the selectable pull-down menu
- Selecting a comparison field from the selectable pull-down menu
- Typing in a value to use in the search (partials allowed; case-insensitive)
If required, a second search rule can be built and joined by the selecting the appropriate Logical Operator. This is useful, especially, for range-searches.
Once the search filter is built, clicking the "Show signatures matching filter" will display all the signatures that match the filter.
A sample range-search filter is shown below:
- Selecting the old event types associated with signatures
-
On the home page, in the section titled "Additonal Info" is a link titled "Search from old Event Types summary". Clicking on this link will display a table showing the event types that were assigned to signatures, before adoption of the event tag schema that is currently being used. The column "Num of Signatures" represents the number of signatures that have that particular event type.
Clicking on the number will display all the signatures that have that particular, old, event type assigned to them.
[
ToC]
Description of Graphs Page
Clicking on the
Graphs link on the page that shows the signature metadata will display graphs of the waveform data associated with that signature. It will show up on a separate browser tab. This tab is reused--i.e. clicking on other
Graphs links will result in associated graphs being displayed in the same browser tab.
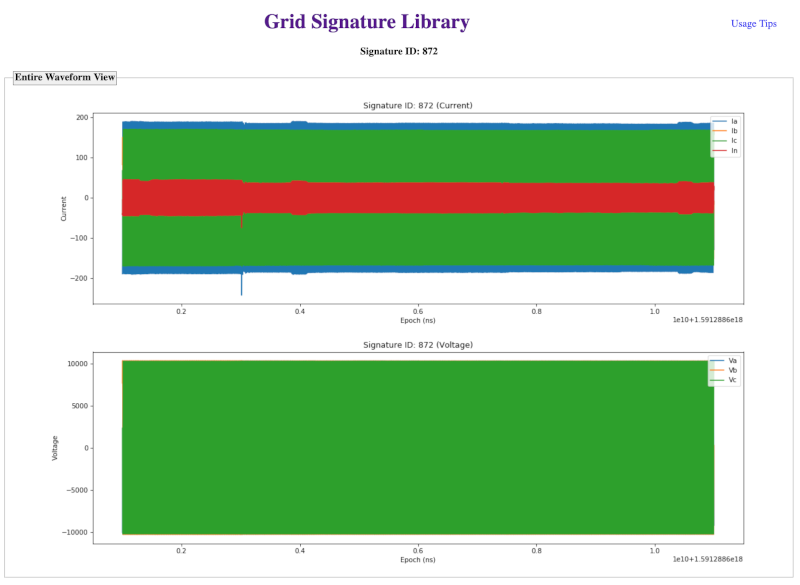
Typically, there would be a section titled "Entire Waveform View", with graphs of the various measurements in it. See example image:
If the data set contain more than 12 cycles worth of data, there will be an additional section titled "Zoomed-in View". These are graphs contain a total of 12 cycles of data, with 2 cycles preceding the event start time. See example image:
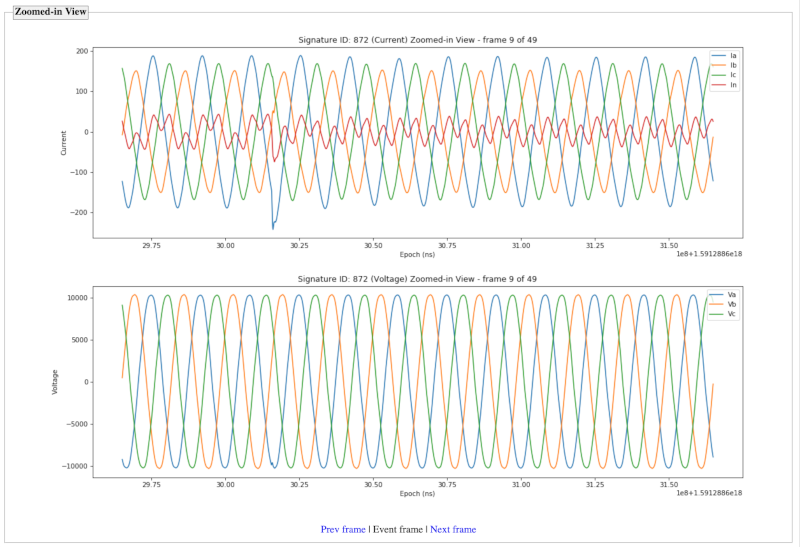
In this case, the graphs in the section "Entire Waveform View" are clickable HTML Image Maps. Clicking anywhere on the graph will show graphs containing 12 cycles of data around the point clicked and it will appear in the section titled "Zoomed-in View".
Additionally, there are navigation links below the graphs in the Zoomed-in View section, to move back and forth around the displayed area.
The term "Event Frame" refers to the frame that contains the start of the event. 12 cycles are shown, starting with 2 cycles before the start of the event.
[
ToC]
Signature Matching Tool
As the name implies, this tool was put together to serve the purpose of basic/rudimentary matching of unknown/unlabeled event waveform data against signatures in GSL. This tool is a limited-capability placeholder while more powerful Machine Learning (MI), Artificial Intelligence (AI) tools that are to be developed for this purpose.
This tool uses the following simple statistical information to look for matching waveforms; i.e. it computes the following statistical values for the unknown/unlabeled event waveform data.
- Min
- Max
- Mean
- Median
- Mode
- Standard Deviation
It then compares it to similar pre-computed statistical data for all the signatures in GSL. Based on the number of statistical values that match within +/- 0.5% range, they are assigned a weighted value. The higher the weight value, the better the match.
Waveform data, belonging to an unknown/unlabeled event, in CSV format, can be ingested into the tool in 2 ways:
- By clicking the "Upload" button and selecting the CSV from the local system to upload
- By providing an URL to an Internet/Intranet accessible CSV file
The format of the CSV data file is described on the page containing the form to upload the file. The form also collects your email address. Upon submission of the form, the tool searches the GSL for matching signatures and prepares a report, the link to which is emailed back to the supplied email address. Upon clicking the link, we would see something like:
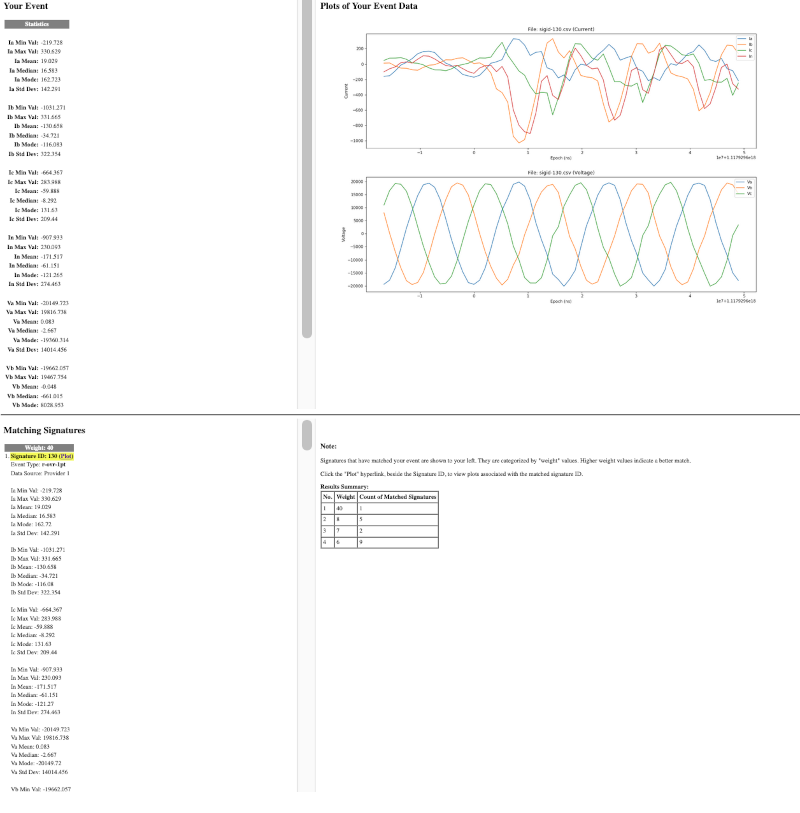
The top half of the screen shows the statistical values and plots for the unknown/unlabeled event data that was uploaded.
The right hand side of the bottom half shows a summary of matched signatures in the GSL, in weighted order. For every weight value, the number of matched signatures are shown. On the left hand side, we can see a listing of the statistical values, categorized by the weight value, for all the matched signatures.
Clicking on the "Plot" link displays the plots for that signature on the right hand side panel. See below image:
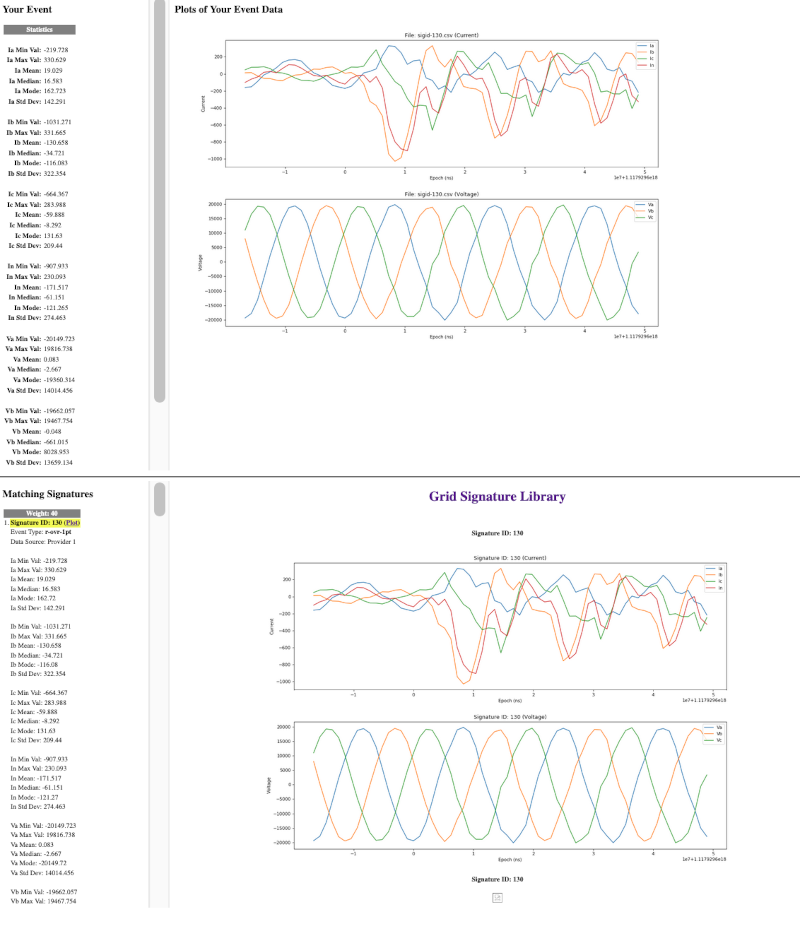
The web page is laid out in such a way as to facilitate comparison of each matched signature plot with the plot of the unknown/unlabeled event data and also the statistical values.
[
ToC]
Frequently Asked Questions
- Why is the site so simple?
The current design was the result of limited resources. It was put together to evaluate industry and academia interest in having a carefully curated, labeled and tagged library of electric power system event signatures. In order for this library to provide value to Machine Learing/Artifical Intelligence efforts for the purposes of signature identification, matching, predictive analytics, etc., wouldn't there be a need, first, to have a well-rounded and well-stocked library?
This is a step in that direction. The library needs a lot more signatures. This is where partnerships with utilities will help tremendously. The plan is evolve the tool and library based on partner recommendations, value proposition and funding. The vision is to have a freely-accessible resource that will be mutually beneficial to utility, industry, academia and research partners.
Also, simple designs and systems are more efficient, cost-effective, reliable, secure, require lower maintenance and, generally, have a longer life and better ROI (Return on Investment).
- Why does the site not use usernames and passwords?
See reasons explained in section "Access and Authorization Information" above.
[
ToC]